Figures
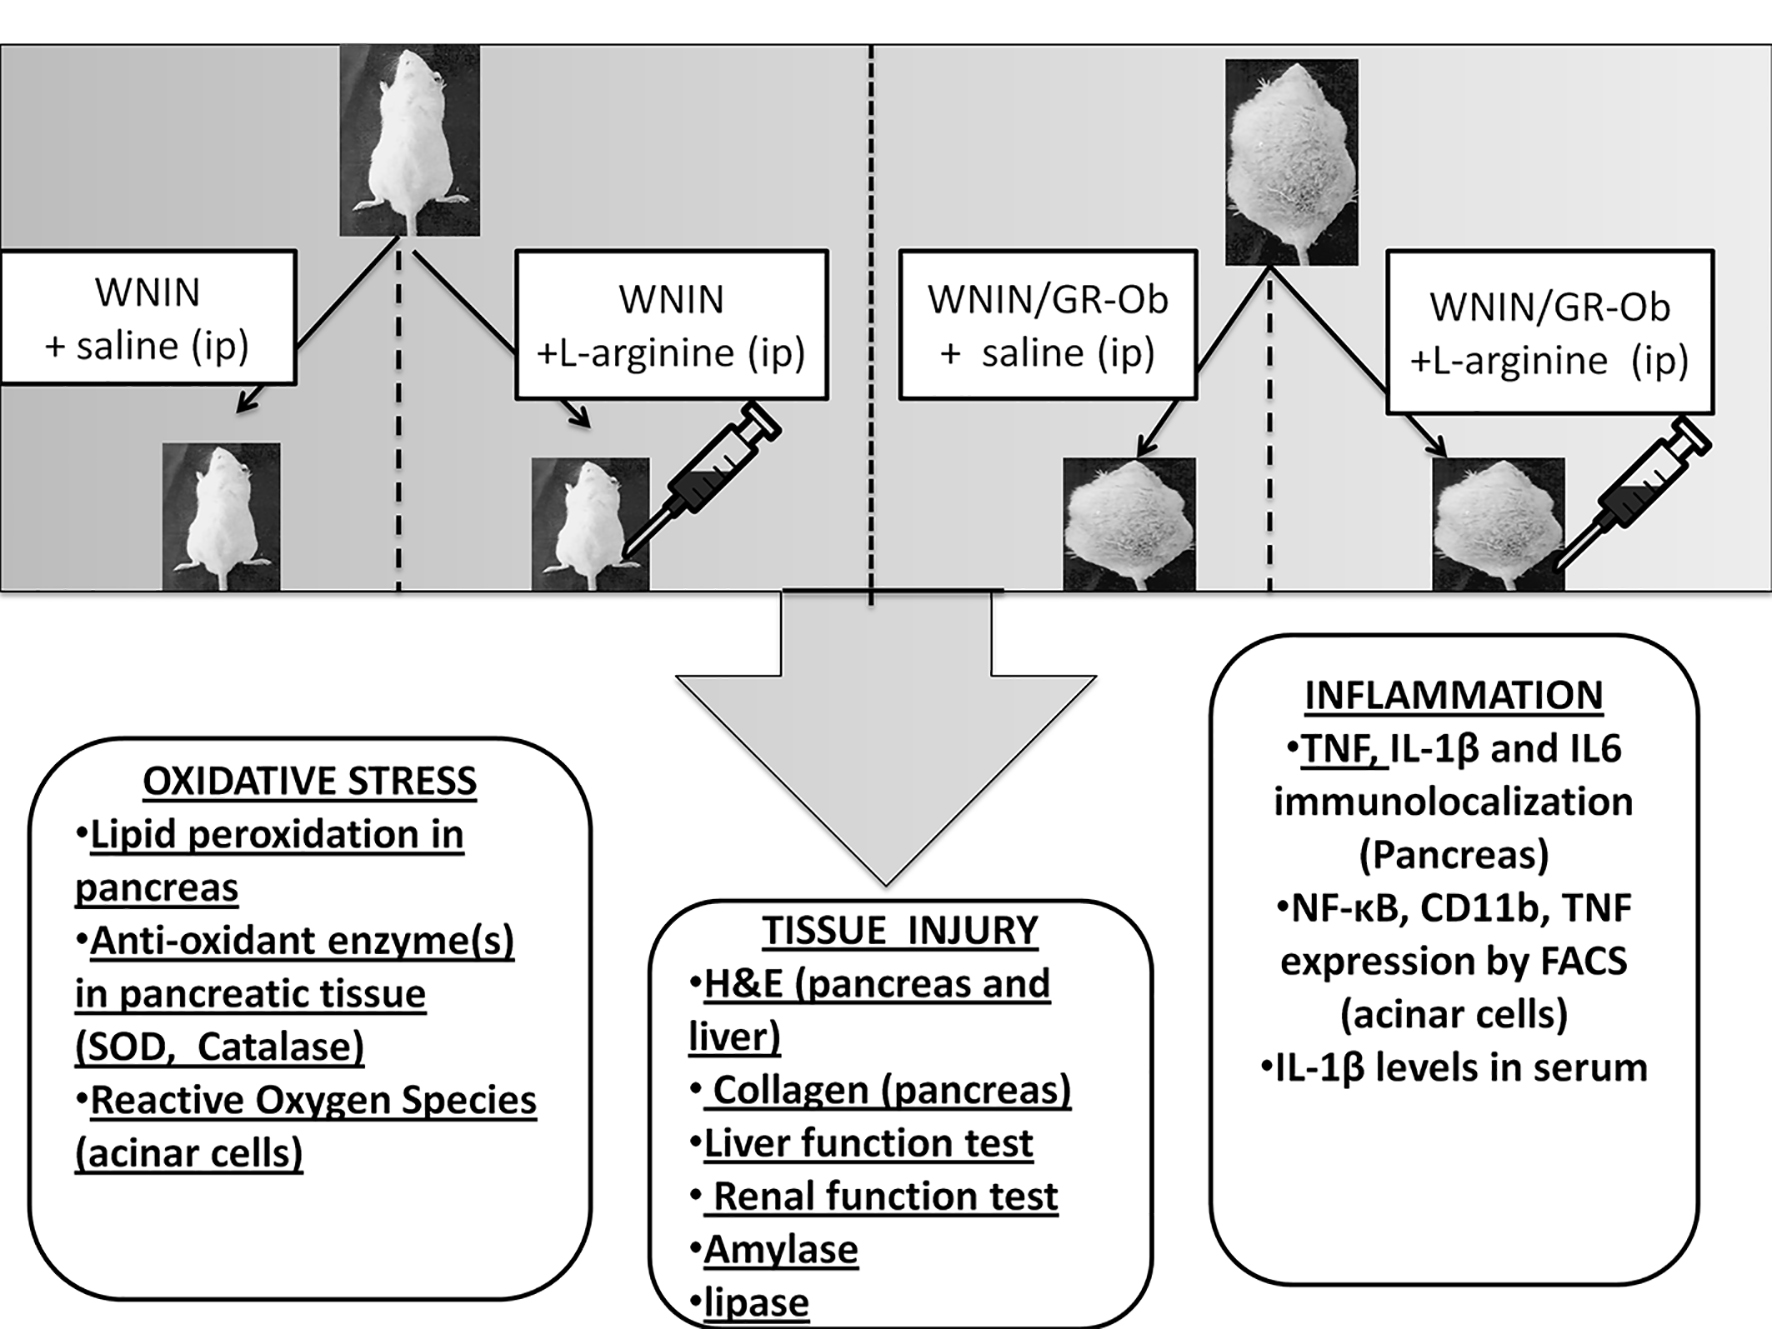
Figure 1. Schematic diagram of the protocol. WNIN/Gr-Ob and control rats were randomly allocated into four groups (six rats in each group). One group of WNIN/Gr-Ob and age-matched WNIN controls were administered L-arginine. Other two groups were WNIN/Gr-Ob and control rats that were administered saline. L-arginine was administered in fed condition and the animals were sacrificed 48 h after treatment. Parameters pertaining to oxidative stress, inflammation, pancreatic injury, islet and acinar cell functions were assessed.
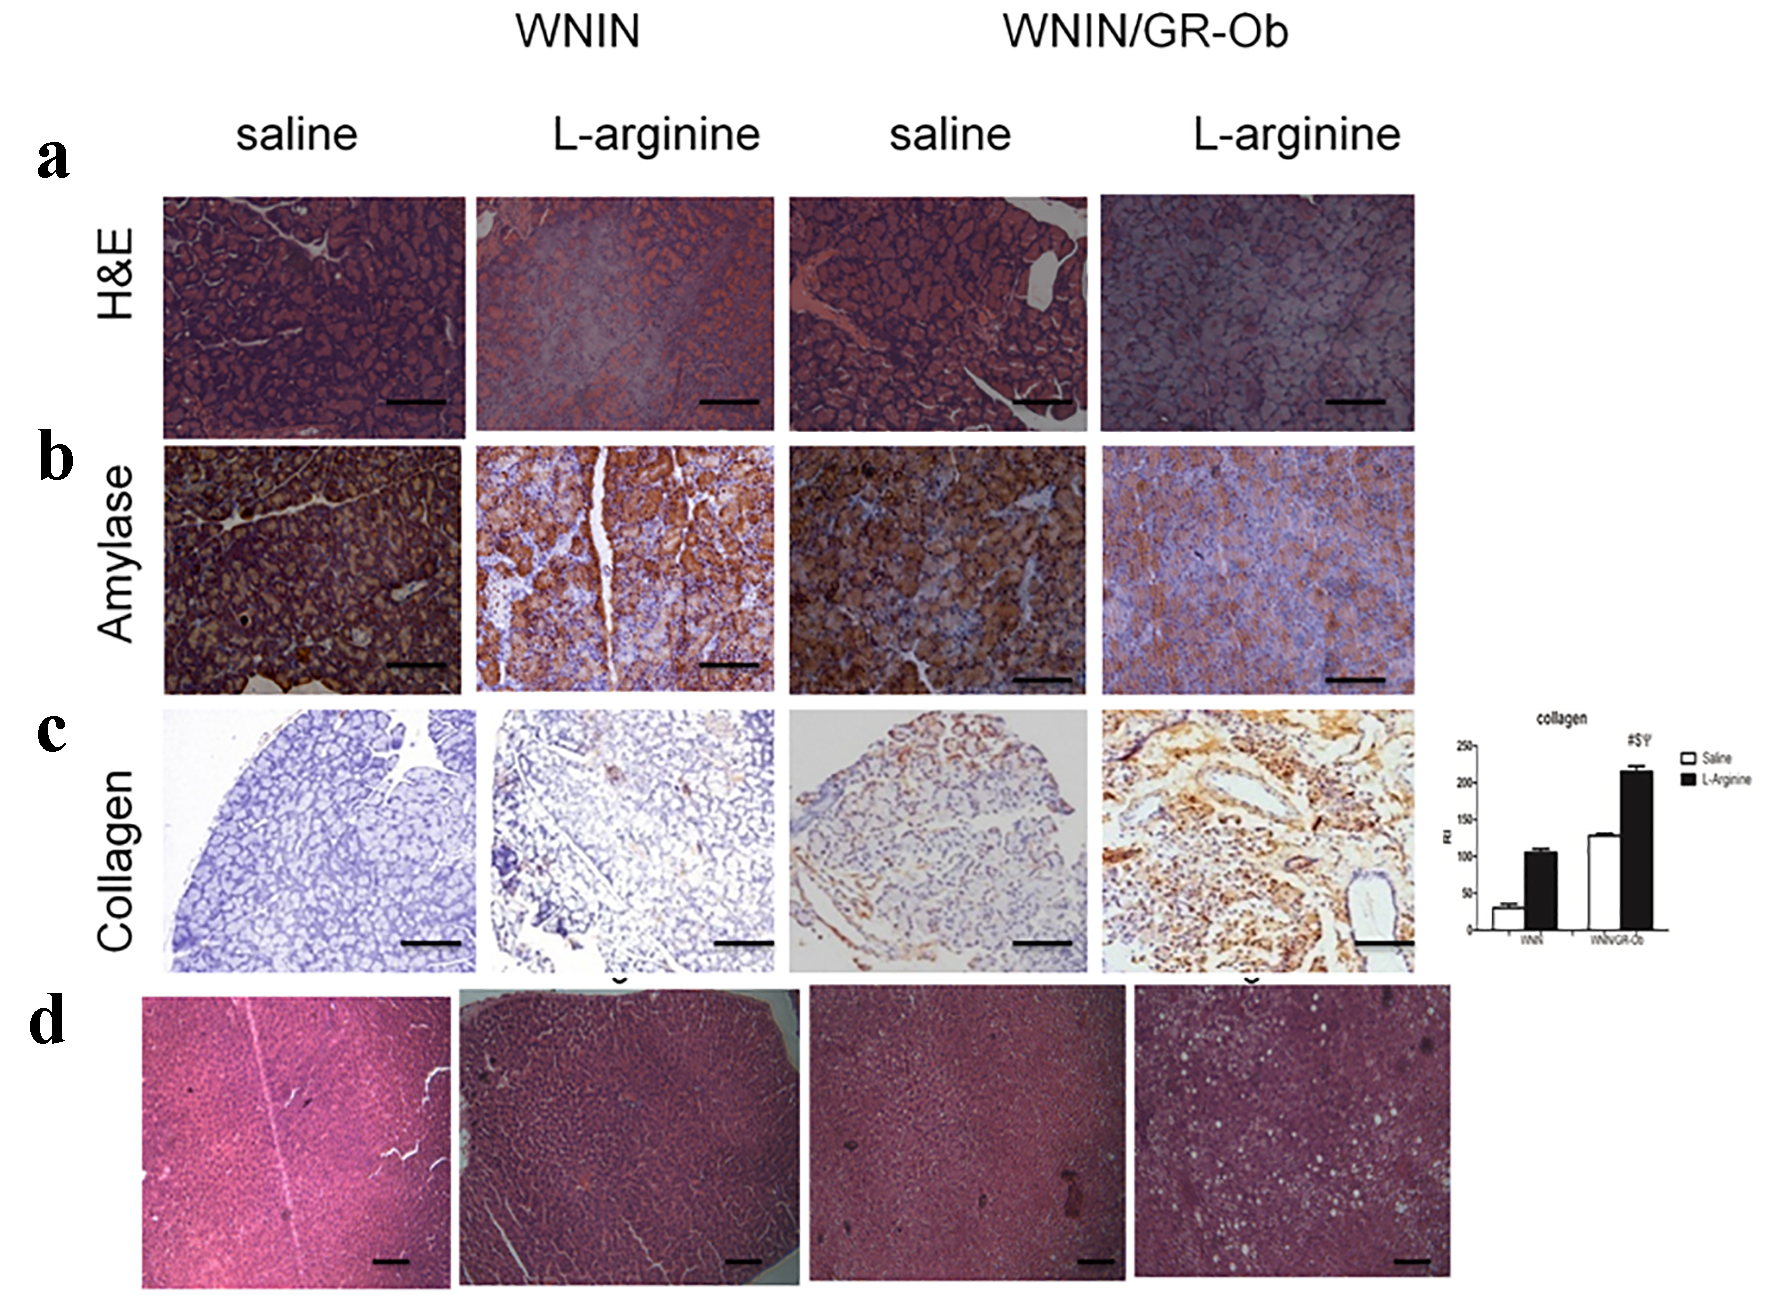
Figure 2. Pathological changes. (a) H&E staining showed increased acinar cell necrosis in WNIN/Gr-Ob administered with L-arginine. (b) Homogenous amylase staining was seen in WNIN rats administered with saline. Administration of L-arginine in WNIN/Gr-Ob and WNIN rats demonstrated increased heterogeneity of amylase staining. The heterogeneity was higher in L-arginine administered WNIN/Gr-Ob as compared to WNIN rats administered with L-arginine. (c) Increased collagen staining was observed in WNIN/Gr-Ob treated with L-arginine as compared to other groups. (d) L-arginine increased vacuoalation in hepatic tissue of WNIN/Gr-Ob rats as compared to control rats. # indicates a significant increase (P < 0.05) as compared to WNIN rats treated with saline, $ denotes a significant increase (P < 0.05) as compared to L-arginine treated WNIN rats, and ѱ indicates a significant increase (P < 0.05) as compared to mutants with saline treatment.
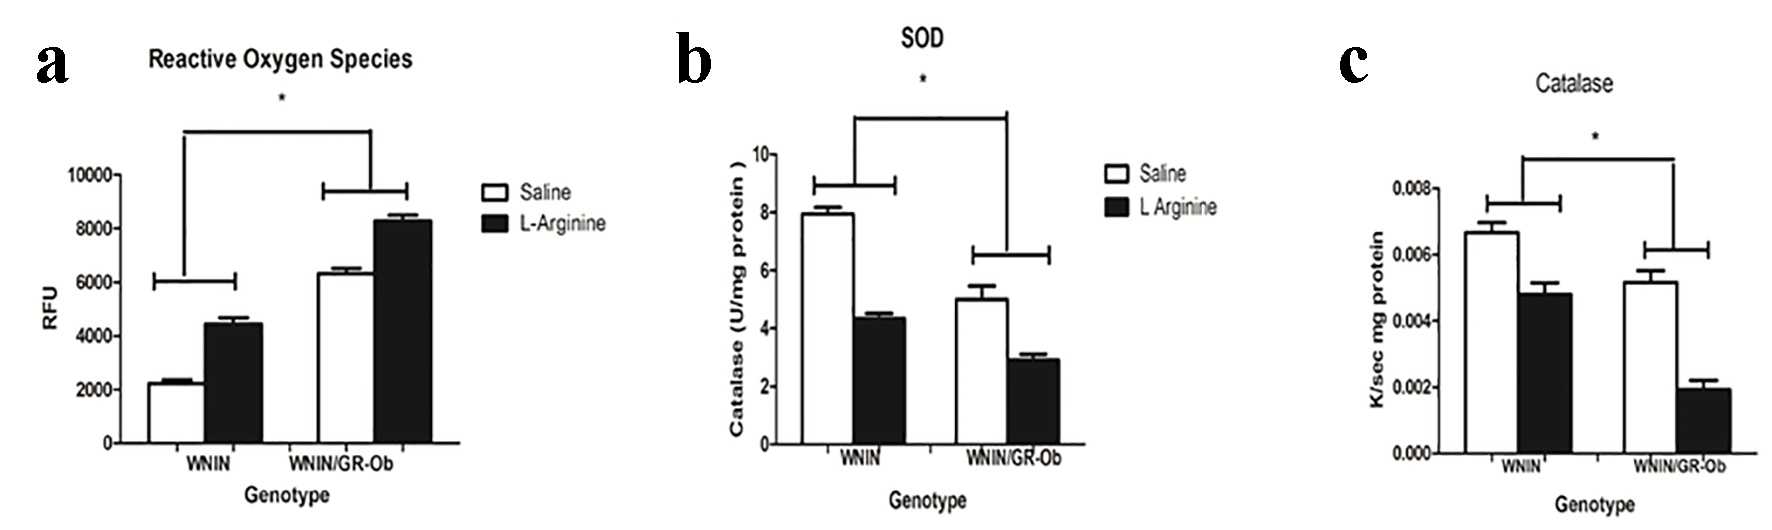
Figure 3. Oxidative stress. (a) ROS was highest in WNIN/Gr-Ob rats as compared to other groups. (b) Lowest superoxide dismutases level-antioxidant enzyme was observed in WNIN/Gr-Ob administered with L-arginine compared to other groups. (c) Pronounced decrease in catalase levels (antioxidant) was observed in L-arginine-induced pancreatitis in WNIN/Gr-Ob rats compared to other groups. *P < 0.05.
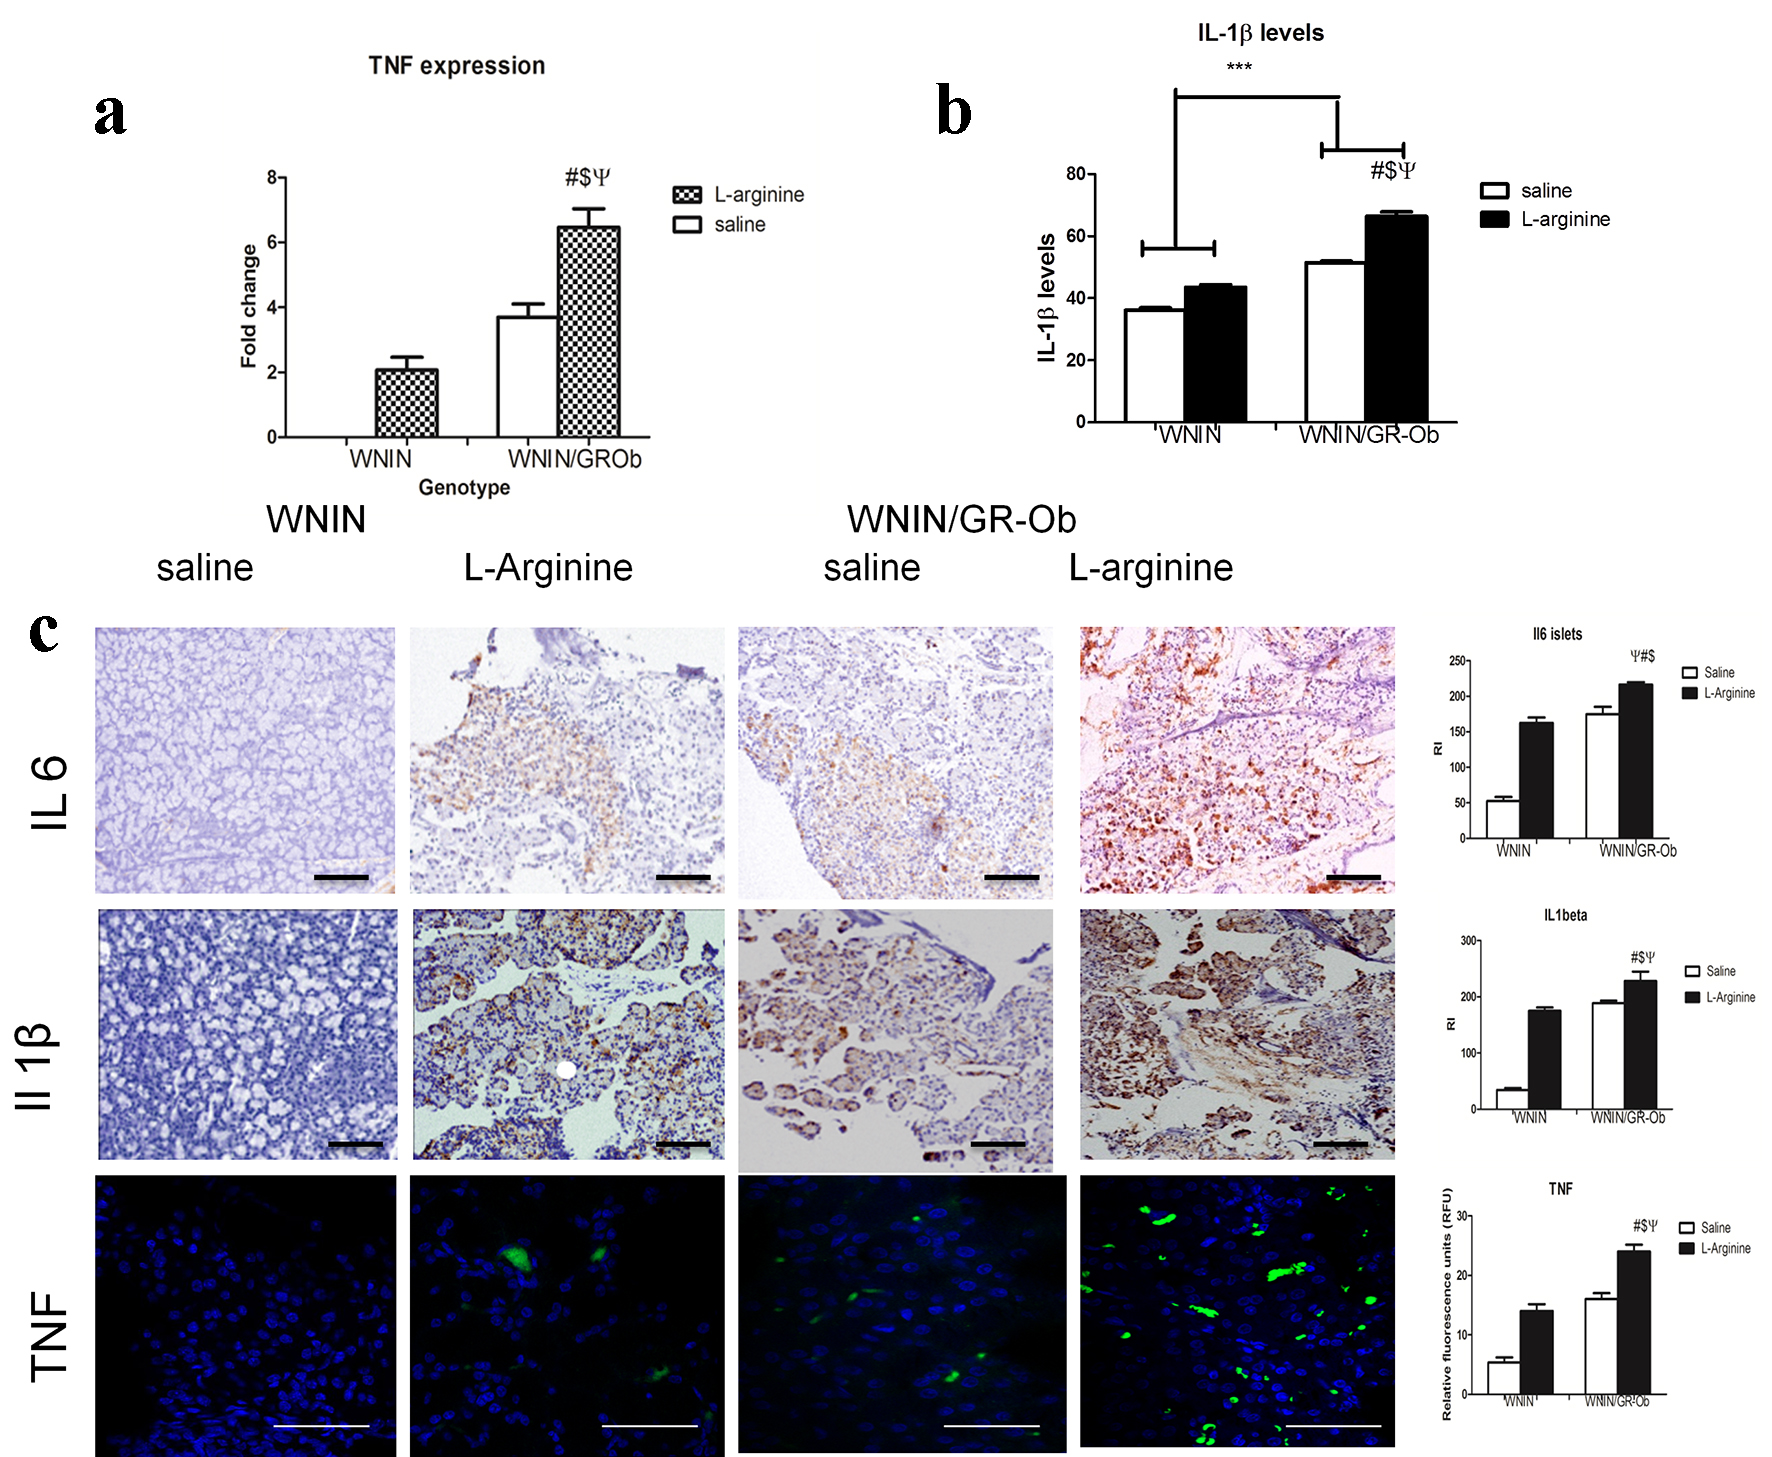
Figure 4. Inflammatory markers. (a) Relative TNF-alpha mRNA levels among the groups are presented as fold changes. mRNA levels for TNF-alpha were significantly upregulated in WNIN/Gr-Ob rats administered with L-arginine. (b) WNIN/Gr-Ob rats administered with L-arginine also showed increased IL-1b protein levels in the serum. (c) Immunolocalization of IL-6, IL-1beta and TNF-alpha in pancratic tissues of all animal groups. # indicates a significant change (P < 0.05) as compared to WNIN rats treated with saline, $ denotes a significant change (P < 0.05) as compared to L-arginine treated WNIN rats, and ѱ indicates a significant change (P < 0.05) as compared to WNIN/Gr-Ob with saline treatment.
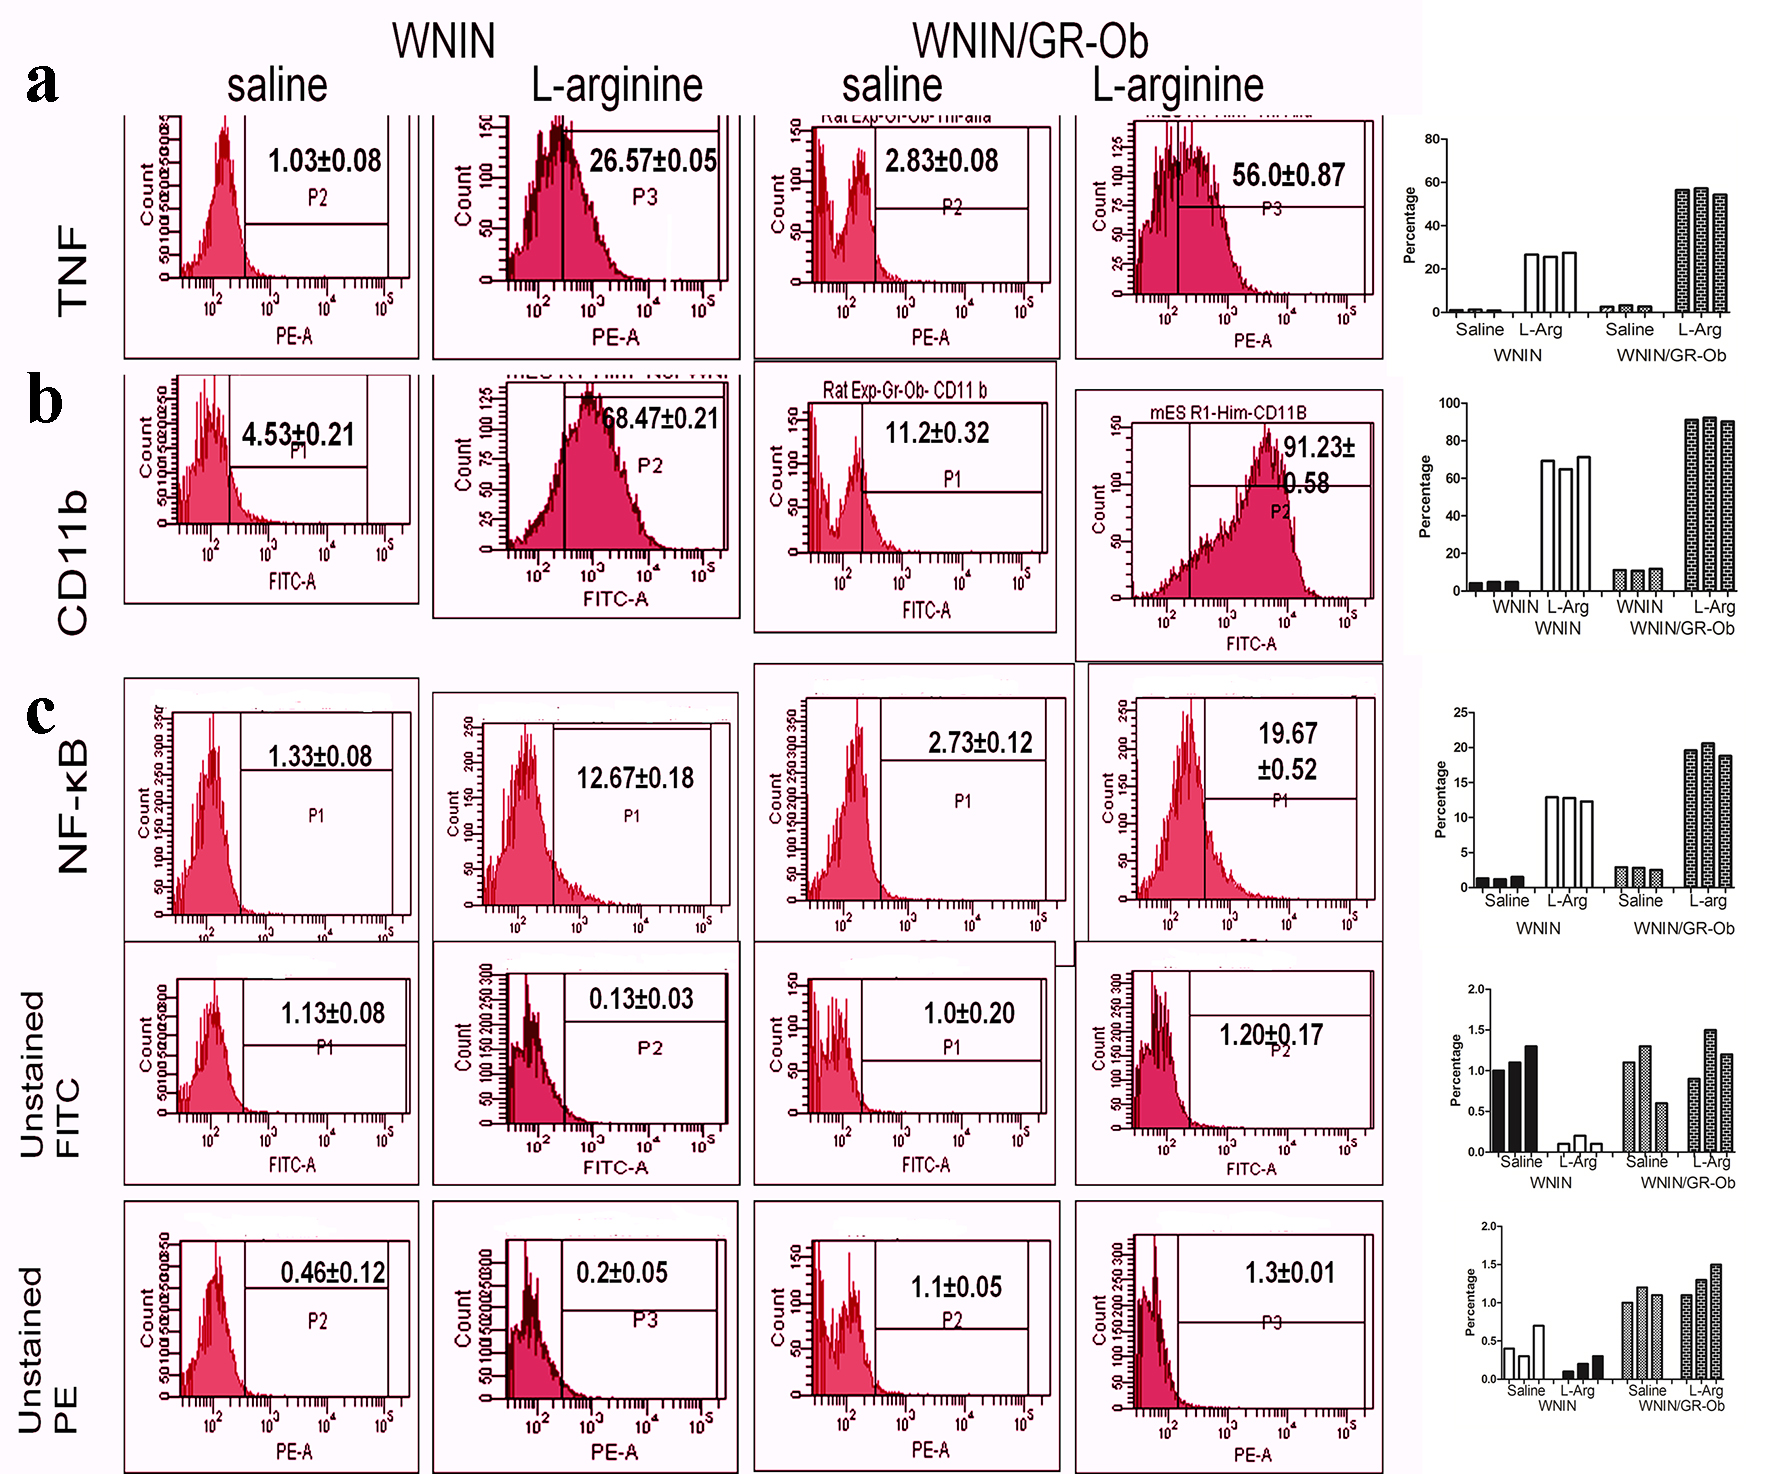
Figure 5. Expression of inflammatory markers (TNF, CD11b and NF-κB) assessed by flow cytometry. Increased TNF, CD11b and NF-κB expression was detected in WNIN/Gr-Ob administered with L-arginine as compared to other groups. A representative flow cytometric histogram for each molecule detected in each group was shown in left panels. Shown in the right plots were results of three independent assays for each molecule from all groups of animals.
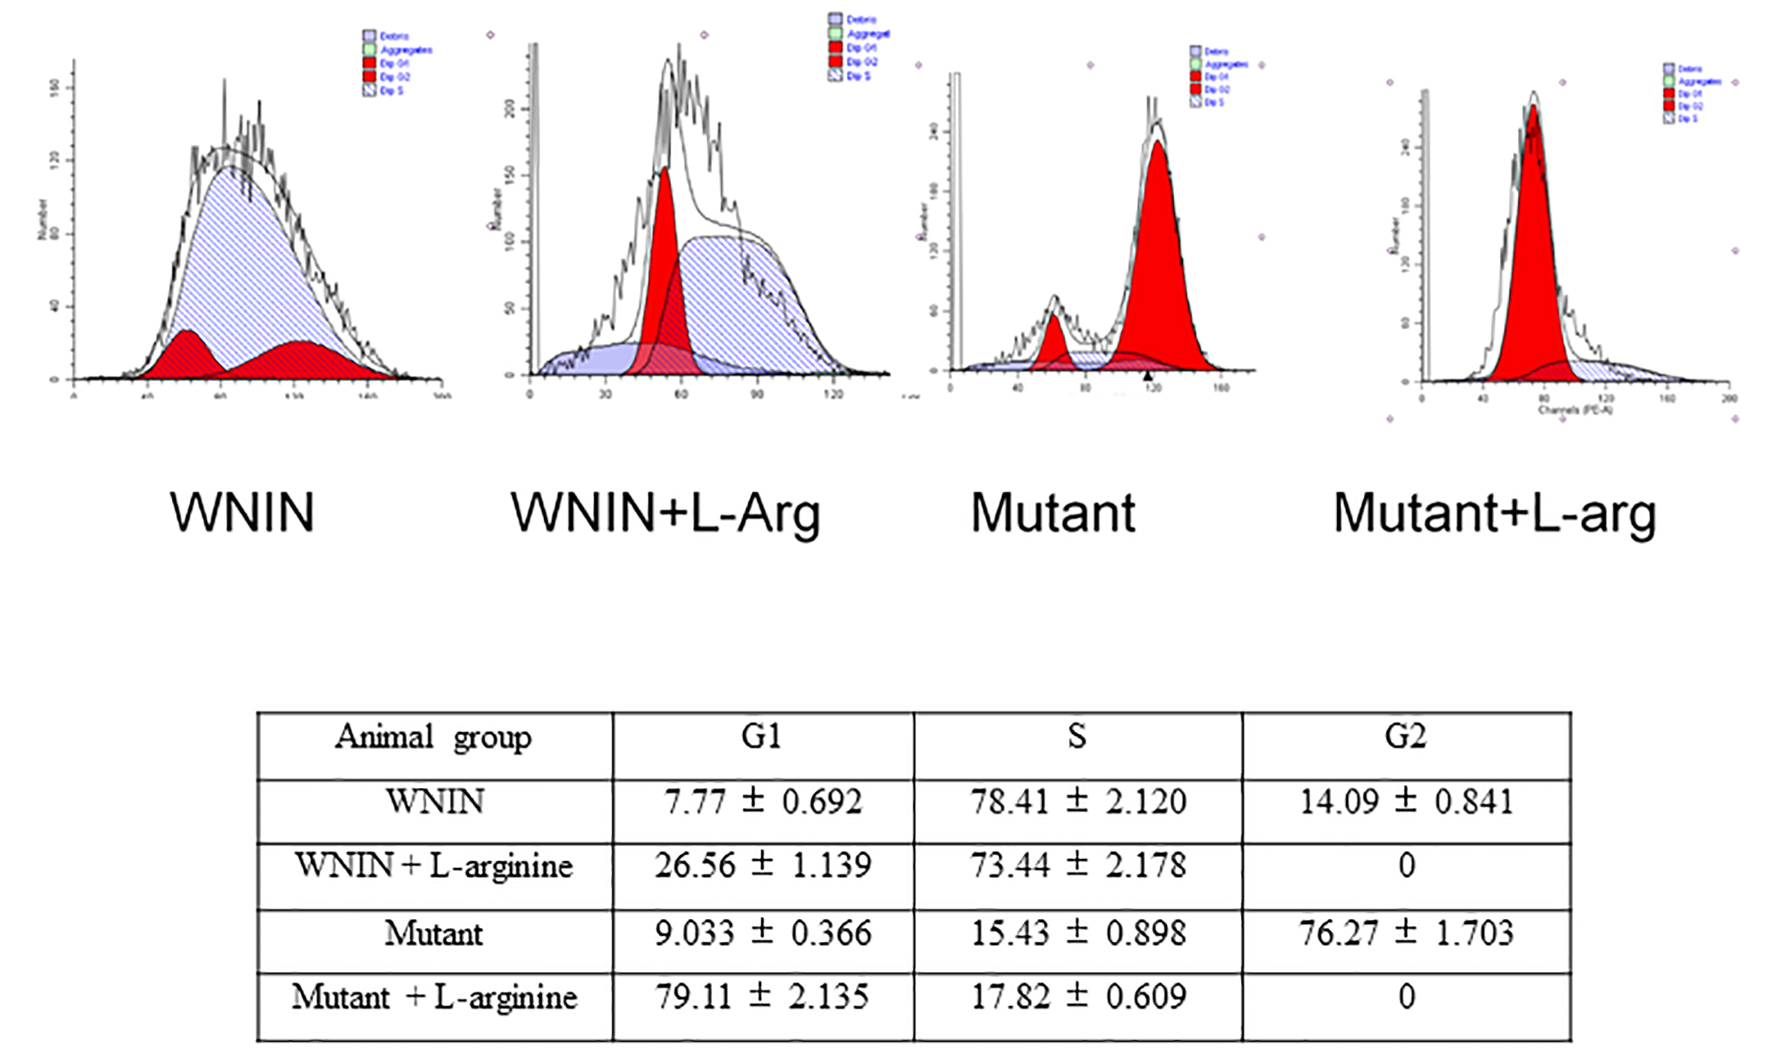
Figure 6. Cell cycle analysis of isolated acinar cells. The figure shows the effect of L-arginine admininistration on acinar cell cycles. The data were computed from three independent experiments.
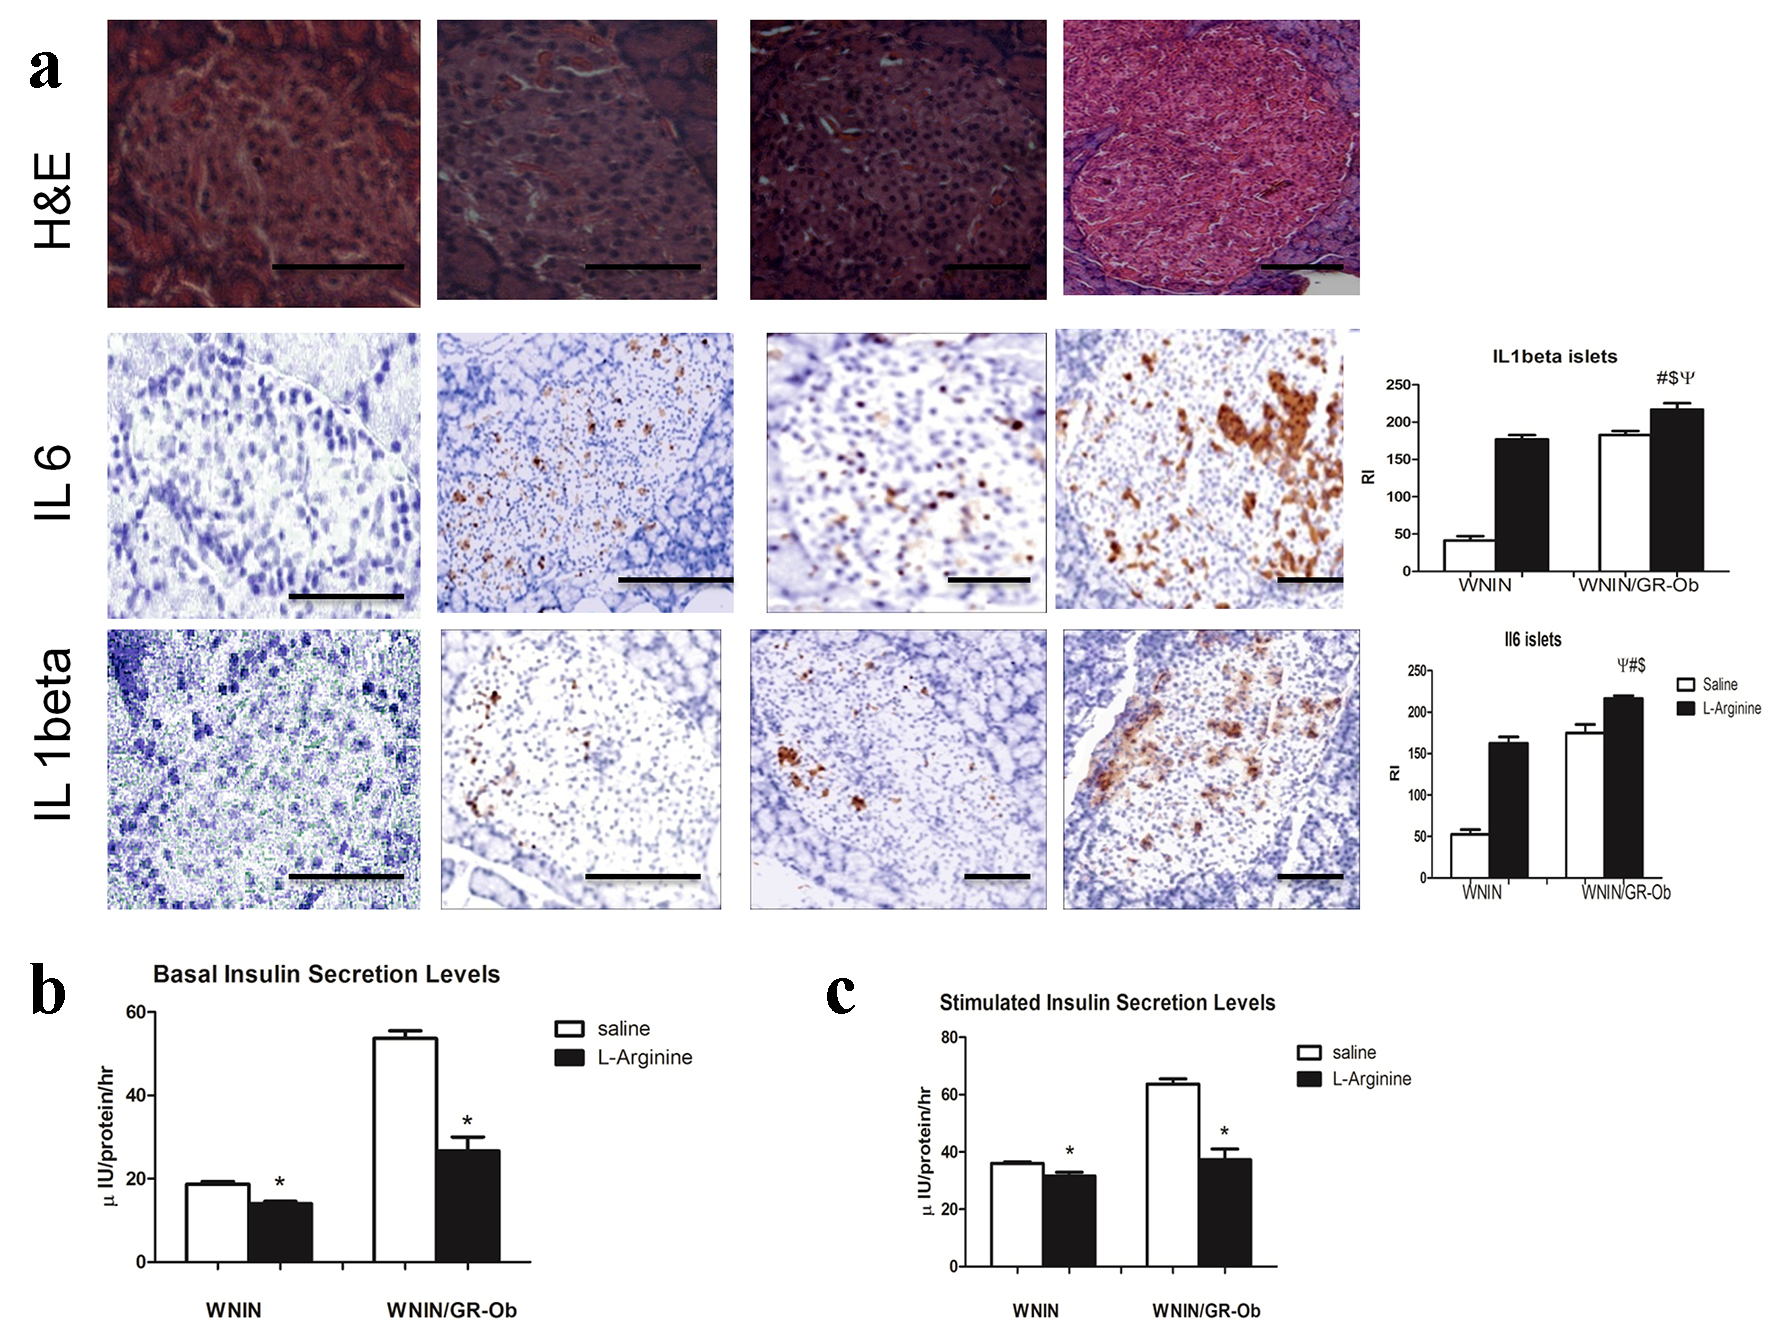
Figure 7. Islet characteristics. (a) Immunolocalization of IL-1β and IL-6 in islets revealed upregulated levels of both molecules in WNIN/Gr-Ob administered with L-arginine as compared to other groups. (b) Insulin secretion assay revealed decreased insulin secretion at basal levels both in WNIN/Gr-Ob as well as WNIN rats when admininistered with L-arginine. (c) Stimulatory index was also decreased in WNIN and WNIN/Gr-Ob rats when L-arginine was administered. # indicates a significant change (P < 0.05) as compared to WNIN rats treated with saline, $ denotes a significant change (P < 0.05) as compared to L-arginine treated WNIN rats, and ѱ indicates a significant change (P < 0.05) as compared to WNIN/Gr-Ob with saline treatment. * indicates a significant reduction compared to saline treated animals.
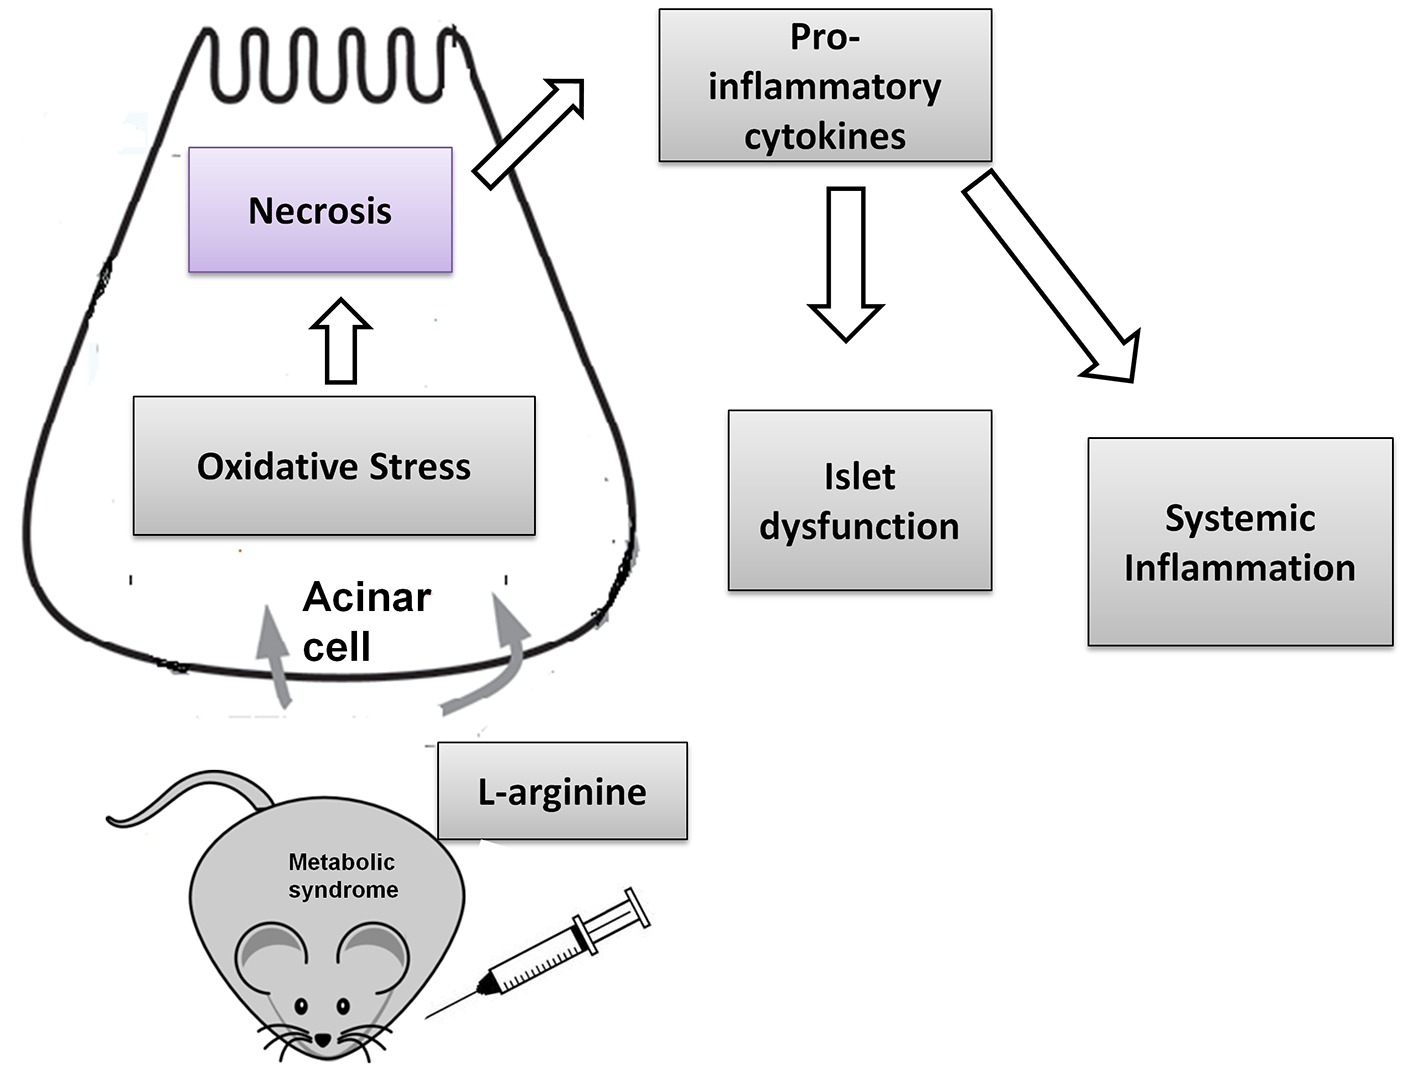
Figure 8. L-arginine induces severe acute pancreatitis in WNIN/GR-Ob rats. The pancreatitis induction may be attributed to increased necrosis of acinar cells and inflammatory cytokines leading to increased systemic inflammation and islet dysfunction.
Table
Table 1. Effect of L-Arginine Administration on Biochemical Parameters in WNIN and WNIN/GR-Ob Rats
| Parameter | WNIN | WNIN + L-arginine | WNIN/GR-Ob rats | WNIN/GR-Ob rats + L-arginine |
|---|
| # indicates significant change (P < 0.05) as compared to control rats. $ indicates significant change (P < 0.05) as compared to L-arginine treated controls and ѱ indicates significant change (P < 0.05) as compared to WNIN/Gr-Ob with saline treatment. |
| Amylase (U/L) | 1,665 ± 286.6 | 4,605 ± 169.5 | 2,305 ± 431 | 6,350 ± 93.18#$ѱ |
| Lipase (U/L) | 46.17 ± 2.548 | 80 ± 5.298 | 61.50 ± 6.168 | 113.3 ± 3.896#$ѱ |
| Aspartate aminotransferase (U/L) | 96.28 ± 2.157 | 154 ± 5.784 | 160.1 ± 6.670 | 264 ± 8.453#$ѱ |
| Alanine transaminase (U/L) | 40.37 ± 0.7911 | 76.12 ± 4.406 | 61.90 ± 2.651 | 148 ± 4.862#$ѱ |
| Alkaline phosphatase (U/L) | 236.8 ± 7.709 | 443.7 ± 10.74 | 316.7 ± 2.092 | 961.7 ± 12.56#$ѱ |
| Globulin (g/dL) | 3.383 ± 0.101 | 2.650 ± 0.076 | 4.633 ± 0.080 | 3.633 ± 0.130 |
| Albumin (g/dL) | 4.117 ± 0.07 | 3.667 ± 0.07 | 4.917 ± 0.174 | 3.733 ± 0.05 |
| A/G ratio | 1.356 ± 0.07 | 1.303 ± 0.01 | 1.139 ± 0.01 | 0.918 ± 0.028#$ѱ |
| Total bilirubin (mg/dL) | 0.350 ± 0.034 | 0.6500 ± 0.034 | 0.06500 ± 0.056 | 1.283 ± 0.079#$ѱ |
| Creatinine (mg/dL) | 0.600 ± 0.023 | 0.810 ± 0.026 | 0.706 ± 0.031 | 0.916 ± 0.052#$ѱ |
| TBARS-serum (nM/mL) | 14.23 ± 0.554 | 24.52 ± 1.260 | 29.40 ± 1.878 | 48.75 ± 2.447#$ѱ |
| TBARS-pancreatic (nM/mg protein) | 0.493 ± 0.016 | 0.747 ± 0.030 | 0.933 ± 0.009 | 1.396 ± 0.107#$ѱ |